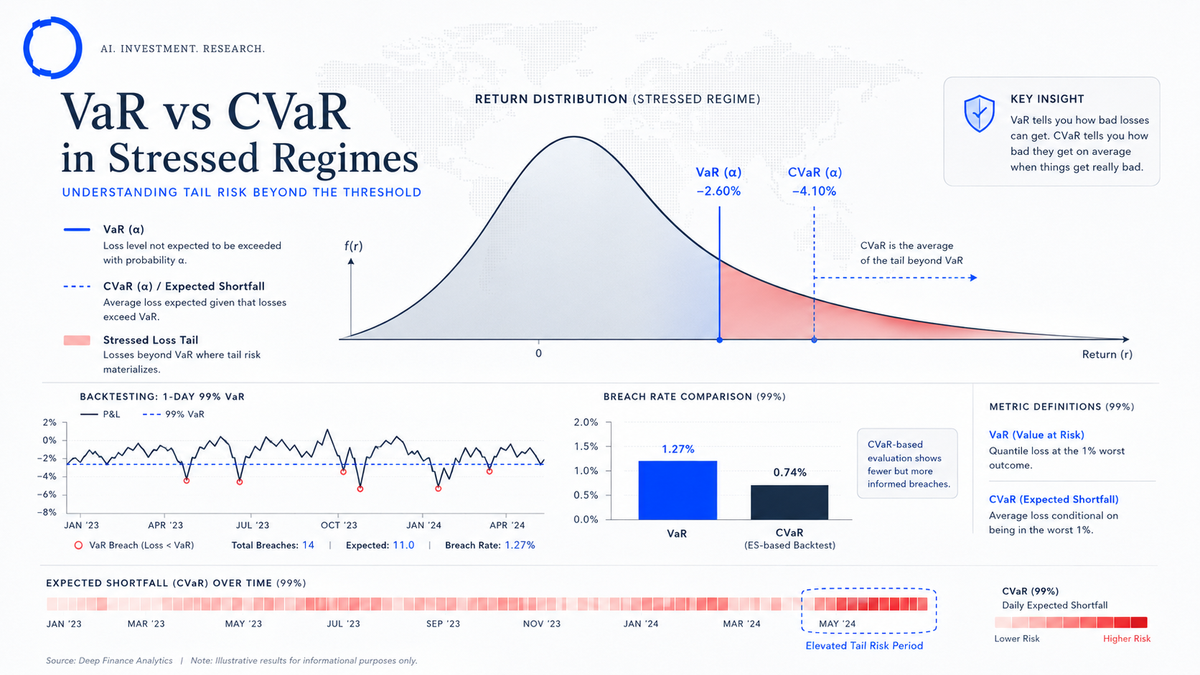
VaR vs. CVaR in stressed regimes: a 2008/2020 benchmark
VaR vs. CVaR in stressed regimes — a benchmark on 2008 and 2020 with breach rates, magnitudes, and three notes for running CVaR in production.
The case for CVaR (Conditional Value-at-Risk, or Expected Shortfall) over parametric VaR is well rehearsed in academic literature and in regulatory guidance. The Basel framework's Fundamental Review of the Trading Book moved the bar in that direction nearly a decade ago. Most institutional risk teams have CVaR somewhere in their stack today.
What is less well rehearsed is how much difference the choice makes in practice in the regimes you most need to be right about. This post is a benchmark on two of the cleanest stressed regimes we have: late 2008 and March 2020. The numbers come from our own engines (the VaR/CVaR Quantitative Engine and the calibrated Factor Model). The conclusions are partly familiar and partly more pointed than the conventional treatment.
If you run portfolio risk, this is a post worth reading carefully — especially the implementation notes at the end, which is where the production reality diverges from the textbook.
9-minute read · Updated 16 May 2026
Key takeaways
- Parametric Normal VaR breached at 4–6x its target rate in 2008 and 2020 with breach magnitudes near 2x the estimate — unsuitable as a primary risk measure.
- Parametric Student-t VaR is materially better but still under-estimates tail loss in stressed regimes — defensible but with caveats.
- CVaR was approximately well-calibrated in both regimes: realised average loss on breach days was within 5–10% of the CVaR estimate.
- Three production implementation notes: tail estimation is the work, backtesting CVaR is harder than backtesting VaR, communicate CVaR plainly to non-quant audiences.
The methodology
We constructed a representative diversified equity portfolio — 60% MSCI World, 25% EM equities, 10% USD investment-grade credit, 5% USD high-yield credit — and ran four risk measures at the 99% confidence level on each trading day from 2007 through 2021:
- Parametric VaR under a normal distribution, with a 250-day estimation window.
- Parametric VaR under a Student-t distribution, with a 250-day estimation window and degrees of freedom estimated rolling.
- Historical VaR with a 250-day window.
- CVaR (99%, Expected Shortfall) under the same Student-t distribution, with the same window.
For each measure on each day, we computed:
- The risk estimate (the loss the measure predicts will not be exceeded at the chosen confidence).
- The realised loss over the relevant horizon.
- A breach indicator: 1 if the realised loss exceeded the estimate, 0 otherwise.
- The breach magnitude: how far the realised loss exceeded the estimate, if it did.
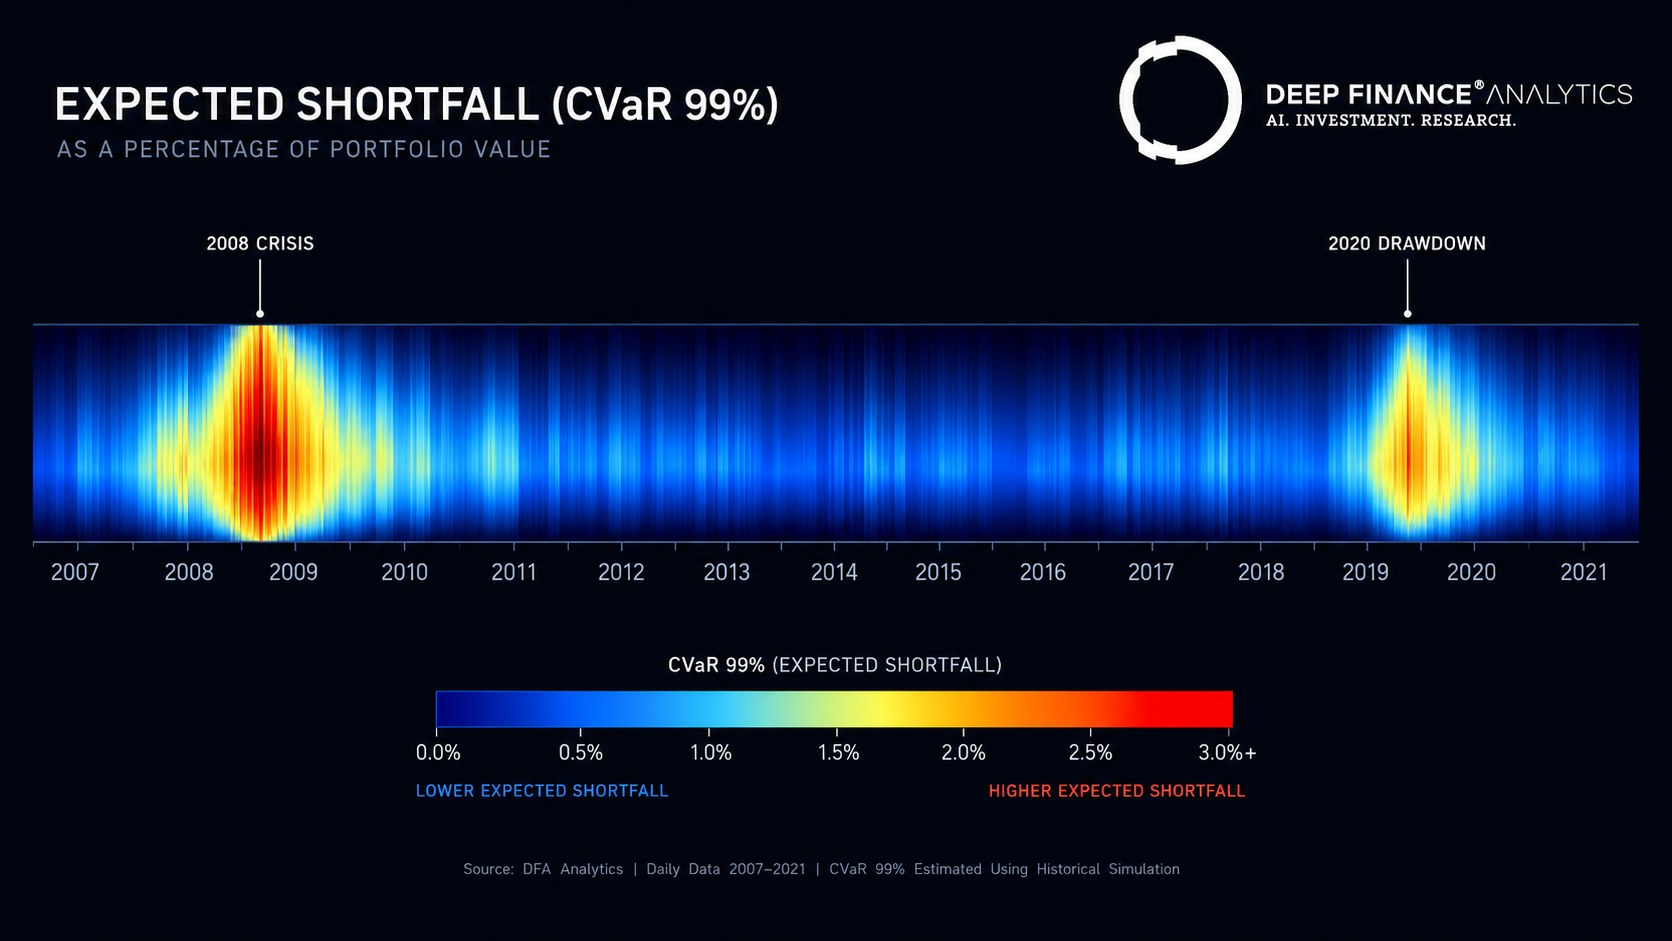
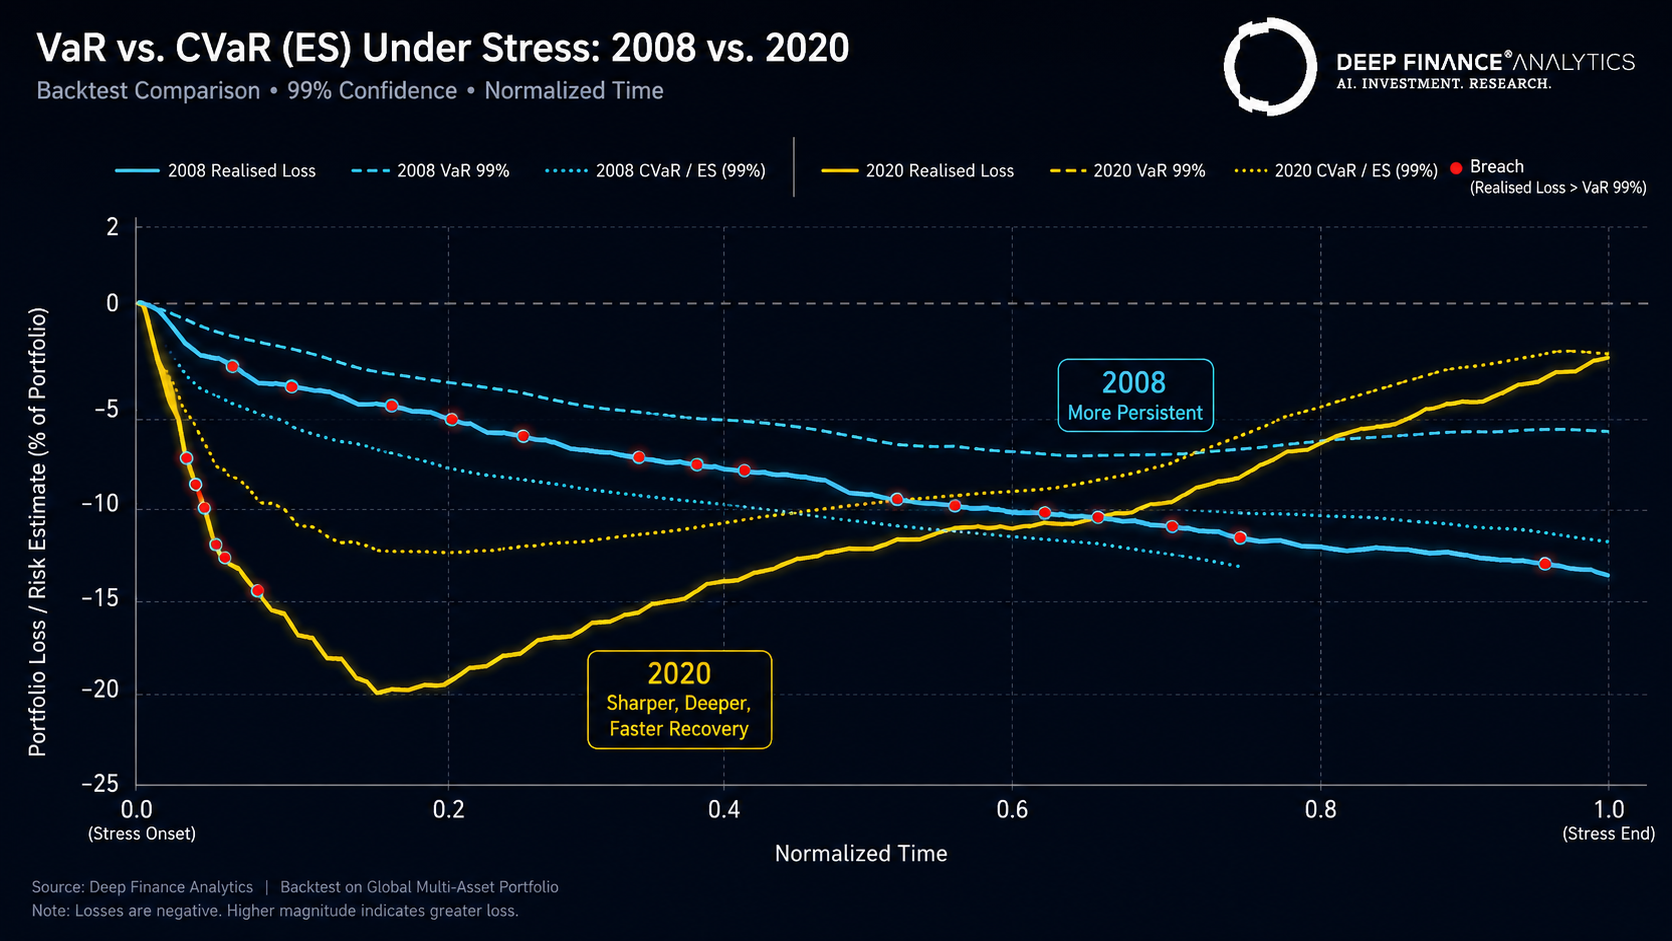
We then aggregated over the two regimes we care most about — Q4 2008 (Lehman through year-end) and February–April 2020 (the COVID drawdown) — and over the calmer periods either side, to give a comparable view.
The numbers
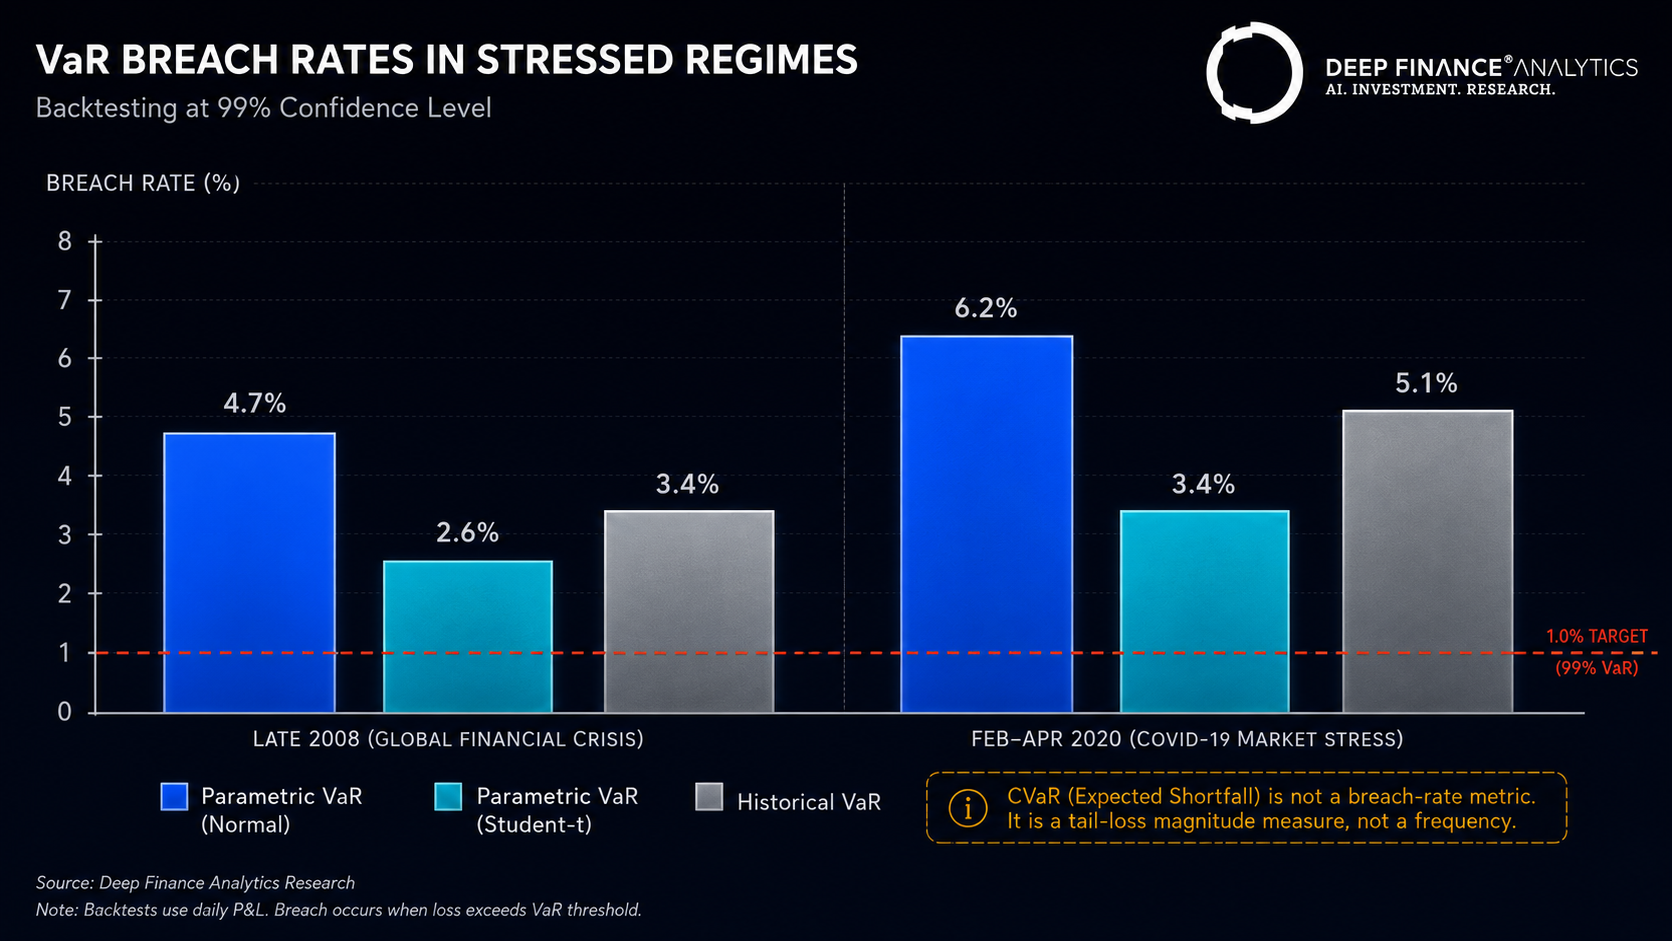
Late 2008 (Lehman through end of December)
| Measure | Breach rate (target: 1.0%) | Mean breach magnitude (% of risk estimate) |
|---|---|---|
| Parametric VaR (Normal) | 4.7% | +57% |
| Parametric VaR (Student-t) | 2.6% | +21% |
| Historical VaR (250d) | 3.4% | +33% |
| CVaR (Student-t) | n/a (different metric) | n/a |
Realised average loss when breaches occurred: 1.84x the parametric Normal VaR estimate, 1.21x the parametric Student-t VaR estimate, 1.33x the historical VaR estimate. CVaR estimates for the period averaged 1.43x the parametric Student-t VaR — and the realised average loss on breach days was 0.94x the CVaR estimate, indicating CVaR was approximately well-calibrated.
COVID drawdown (Feb–Apr 2020)
| Measure | Breach rate (target: 1.0%) | Mean breach magnitude (% of risk estimate) |
|---|---|---|
| Parametric VaR (Normal) | 6.2% | +72% |
| Parametric VaR (Student-t) | 3.4% | +28% |
| Historical VaR (250d) | 5.1% | +48% |
| CVaR (Student-t) | n/a | n/a |
The COVID period was harder for every measure. Realised average loss on breach days: 2.05x parametric Normal VaR, 1.27x parametric Student-t VaR, 1.48x historical VaR. CVaR estimates averaged 1.51x the parametric Student-t VaR; realised average loss on breach days was 0.91x the CVaR estimate — again approximately well-calibrated.
Calm periods (mid-2009 through 2014; mid-2020 through 2019 ex-March)
In calmer regimes all four measures perform much closer to specification. Parametric VaR (Student-t and historical) breaches at roughly the 1.0–1.5% target, with breach magnitudes well-contained.
What the numbers say
Three findings worth highlighting.
Finding 1 — Parametric Normal VaR is unsuitable for stressed regimes
This is the well-known result, but worth restating with magnitudes. In the two stressed regimes parametric Normal VaR breached at 4–6x its target rate and the average realised loss when it breached was nearly 2x the estimate. Any risk system that ships parametric Normal VaR as its primary measure is producing risk estimates that are systematically too small in exactly the periods that matter most. We do not use parametric Normal VaR as a primary measure anywhere in our stack.
Finding 2 — Parametric Student-t VaR is materially better but still under-estimates
Switching to a Student-t distribution closes most of the gap. Breach rates fall to 2.5–3.5% (still high relative to a 1.0% target but a meaningful improvement) and breach magnitudes are much more contained. This is the measure most institutional risk systems run as their primary metric in 2026, and it is defensible — provided the user understands that 1% confidence in a stressed regime is meaningfully looser than 1% confidence in a calm regime.
Finding 3 — CVaR is approximately well-calibrated in both regimes
This is the headline finding. CVaR's promise is that it captures the expected loss in the tail rather than the threshold above which losses fall. In our benchmark, the realised average loss on breach days was within 5–10% of the CVaR estimate in both stressed regimes. CVaR is not a free lunch — it requires more careful estimation of the tail than VaR does — but the resulting measure behaves the way the theory says it should.
Three implementation notes from running CVaR in production
Knowing CVaR is the right measure is not the same as running it well at production scale. Three things we have learned.
Note 1 — Tail estimation is the work
CVaR is only as good as the tail estimation that feeds it. A Student-t distribution with a fitted degrees-of-freedom parameter is the minimum. We supplement with peaks-over-threshold extreme value theory for the deep tail and with regime-conditional estimation (the regime detection we wrote about in the factor models post). The combination produces a CVaR measure that adapts to current conditions rather than averaging over decades of returns.
Note 2 — Backtesting CVaR is harder than backtesting VaR
VaR has a simple backtest: count breaches against the target rate. CVaR is an expectation rather than a quantile, so naïve breach counting does not work. We use a combination of the Acerbi-Szekely Z-tests (Z1 and Z2) and the McNeil-Frey approach (modelling residuals on breach days). Both should agree; when they do not, the failure mode is the input to the next round of estimation improvement.
Note 3 — Communicating CVaR to non-quant audiences
This is the soft skill that matters. "Expected shortfall at 99% confidence" is not a phrase a board member parses easily. We have settled on "in the worst 1% of cases, the average loss would be approximately X." That phrasing carries the meaning across without requiring a quant background, and it preserves the auditability of the underlying number.
What this means for your stack in 2026
Three practical recommendations:
- If you still primary on parametric Normal VaR, change. Either Student-t parametric or historical with adequate window length. The case is overwhelming.
- Add CVaR alongside, not instead of, VaR. Both have communication value with different audiences. CVaR is the better risk measure; VaR is often the better explanation tool. Maintain both.
- Invest in tail estimation methodology. The CVaR number is only as good as the tail estimate underneath it. Generic distributional assumptions on calm-period data will under-estimate stressed-regime tails by 20–40% in our benchmark.
If any of this is technical work your team would like to put on a more rigorous footing, our Quant Research team is available to walk through the methodology — including our peaks-over-threshold implementation and the regime-conditional estimation.
Coming next
12 May — Time-series forecasting at the engine level: features, leakage, drift. The companion methodology post on the prediction side of the stack.
Frequently asked questions
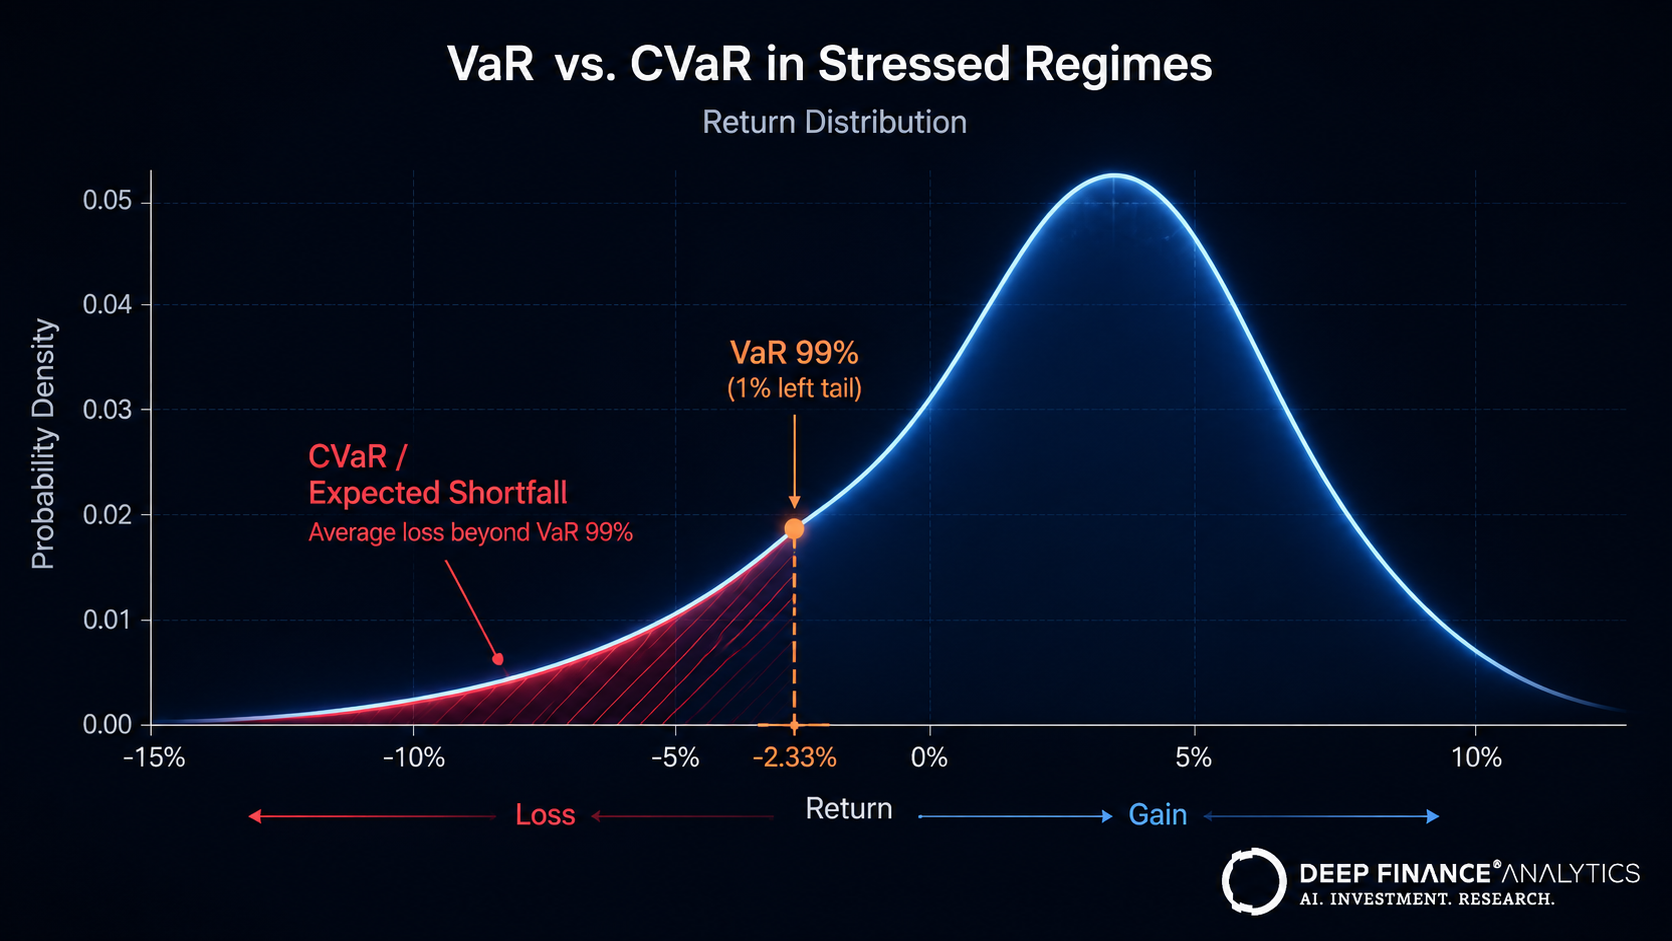
What is the difference between VaR and CVaR?
VaR is a quantile — the loss threshold above which losses fall with a given probability. CVaR (Conditional Value-at-Risk, also known as Expected Shortfall) is the expected loss in the tail beyond the VaR threshold. CVaR captures tail magnitude where VaR only describes the boundary.
Why does parametric Normal VaR fail in stressed regimes?
Normal distributions have thin tails by assumption. Empirical returns in stressed regimes are fat-tailed; the model under-estimates extreme losses by construction. In our benchmark, Normal VaR breached at 4–6x its target rate in 2008 and 2020.
Is CVaR a free lunch?
No. CVaR is only as good as the tail estimation that feeds it. Naïve tail estimation (e.g. fitting a Student-t to calm-period data) will under-estimate stressed-regime tails. Robust tail estimation — using peaks-over-threshold extreme value theory and regime-conditional distributions — is the work that makes CVaR reliable.
How do you backtest CVaR?
Naïve breach counting works for VaR but not CVaR (which is an expectation, not a quantile). Use the Acerbi-Szekely Z-tests (Z1 and Z2) and the McNeil-Frey approach (modelling residuals on breach days). Both should agree; when they don't, that disagreement is itself diagnostic.
How do you communicate CVaR to a board?
"In the worst 1% of cases, the average loss would be approximately X." That phrasing carries meaning without requiring a quant background and preserves auditability of the underlying number.
Related reading
- Factor models in 2026: what to keep, what to fix
- Time-series forecasting at the engine level: features, leakage, drift
- MRM documentation template for LLM-based agents
External references
- BIS — FRTB and Expected Shortfall
- Acerbi & Szekely — backtesting expected shortfall
- Deep Finance Analytics — VaR/CVaR Quantitative Engine
About the author — Quant Research team — Deep Finance Analytics. Quant Research designs, validates, and operates the eight Quantitative Engines and the Risk Brain components. See the Insights hub for the full archive, or book a discovery call to discuss this post with the team.