Industry Risk Intelligence Platform — free sector lens
A free-tier sector risk lens — aggregate idiosyncratic risk, Risk Heartbeat coherence, sentiment compression, microstructure and regulatory signal by sector.

The Industry Risk Intelligence Platform is the one product in our portfolio that we routinely recommend to people who will never become paying customers. It is in our free tier precisely because we believe a clean sector view, refreshed daily and grounded in the same agent stack and quantitative engines as our enterprise platforms, is genuinely useful — and that it earns trust faster than any white paper we could write.
This post is the spotlight: what the platform shows, how to use it, where the boundaries are, and the natural path to paid tiers for the readers who want to push further.
7-minute read · Updated 16 May 2026
Key takeaways
- Eighteen sectors covered, refreshed daily, with two-year history on aggregate metrics, top-decile flagged issuers (anonymised in free tier), and trailing 90-day evidence chain.
- Three usage patterns: weekly sector pulse, hypothesis testing against agent-derived signals, and reading Insights posts with sector context.
- Paid tiers extend in three directions: issuer-level naming, custom universe (private credit, fund holdings), and integration with PortIQ / CyronOS.
- The platform is genuinely free — no waiting list, no sales call required — because the cost story from the two-tier agent design makes it economically possible.
The job the platform does
A portfolio manager, an analyst, or a curious controller wants to answer questions like:
- Which sectors look stressed right now on idiosyncratic dispersion, not just on price?
- Where are agent-detected language and microstructure signals strongest this week?
- What is the cross-sectional spread of risk inside Financials, Industrials, Tech?
- Has the AI-infrastructure cluster's risk profile changed materially in the last 90 days?
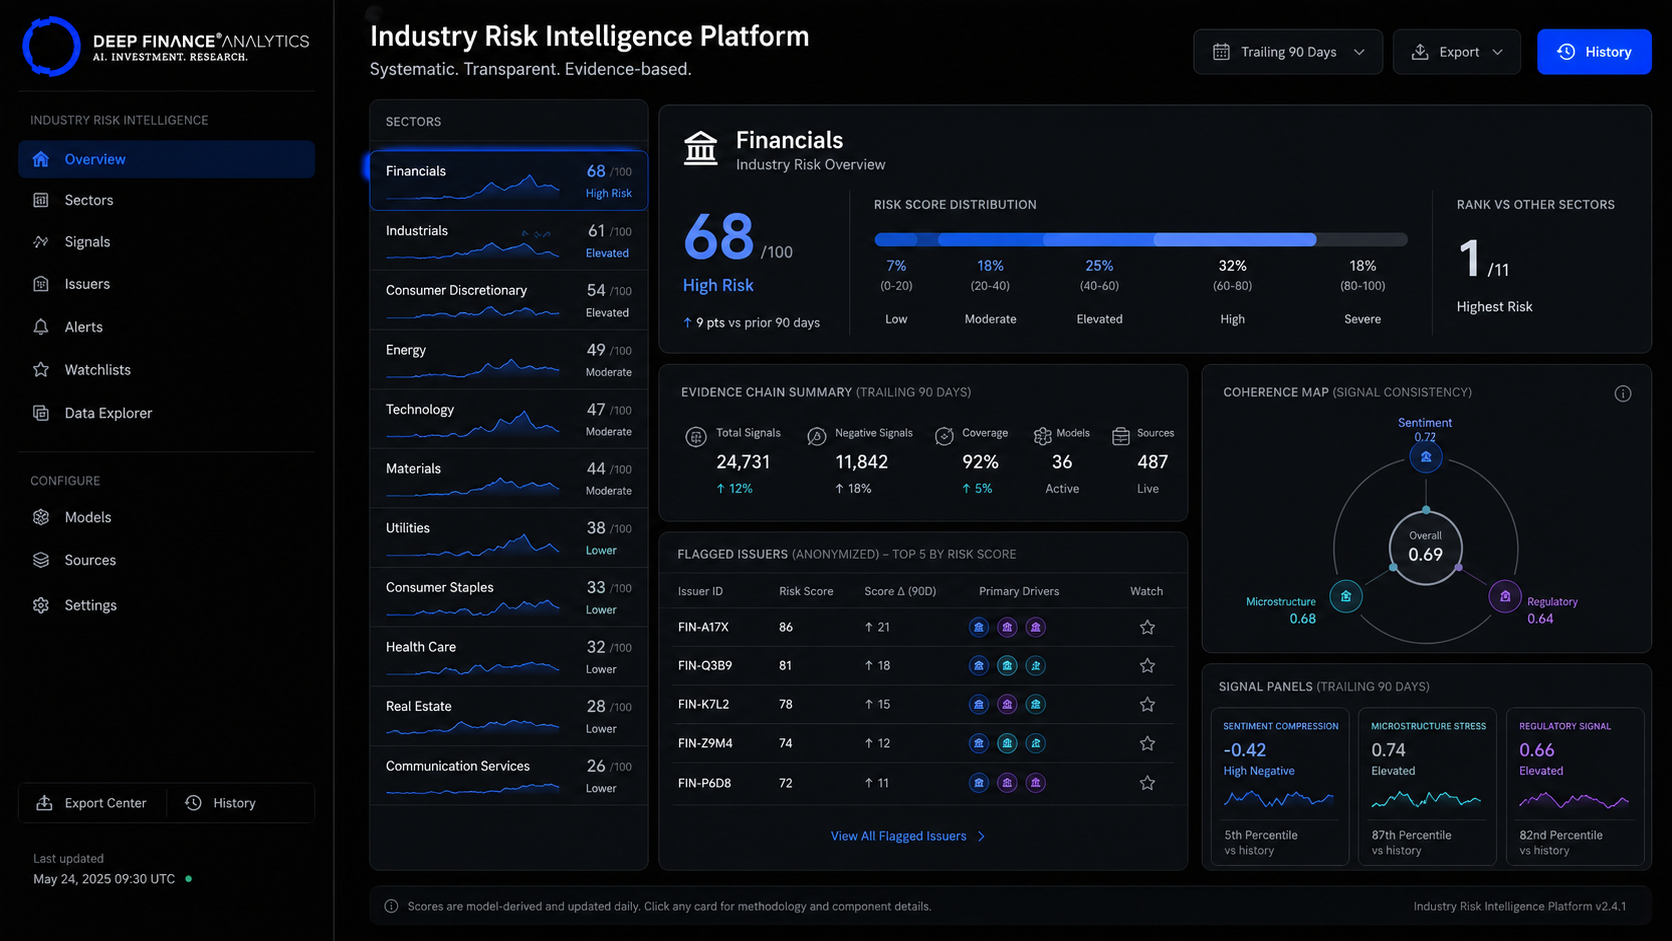
The Industry Risk Intelligence Platform produces a single screen per sector that answers these questions, refreshes daily, and links every number back to the underlying agent-derived evidence.
What you see when you open it
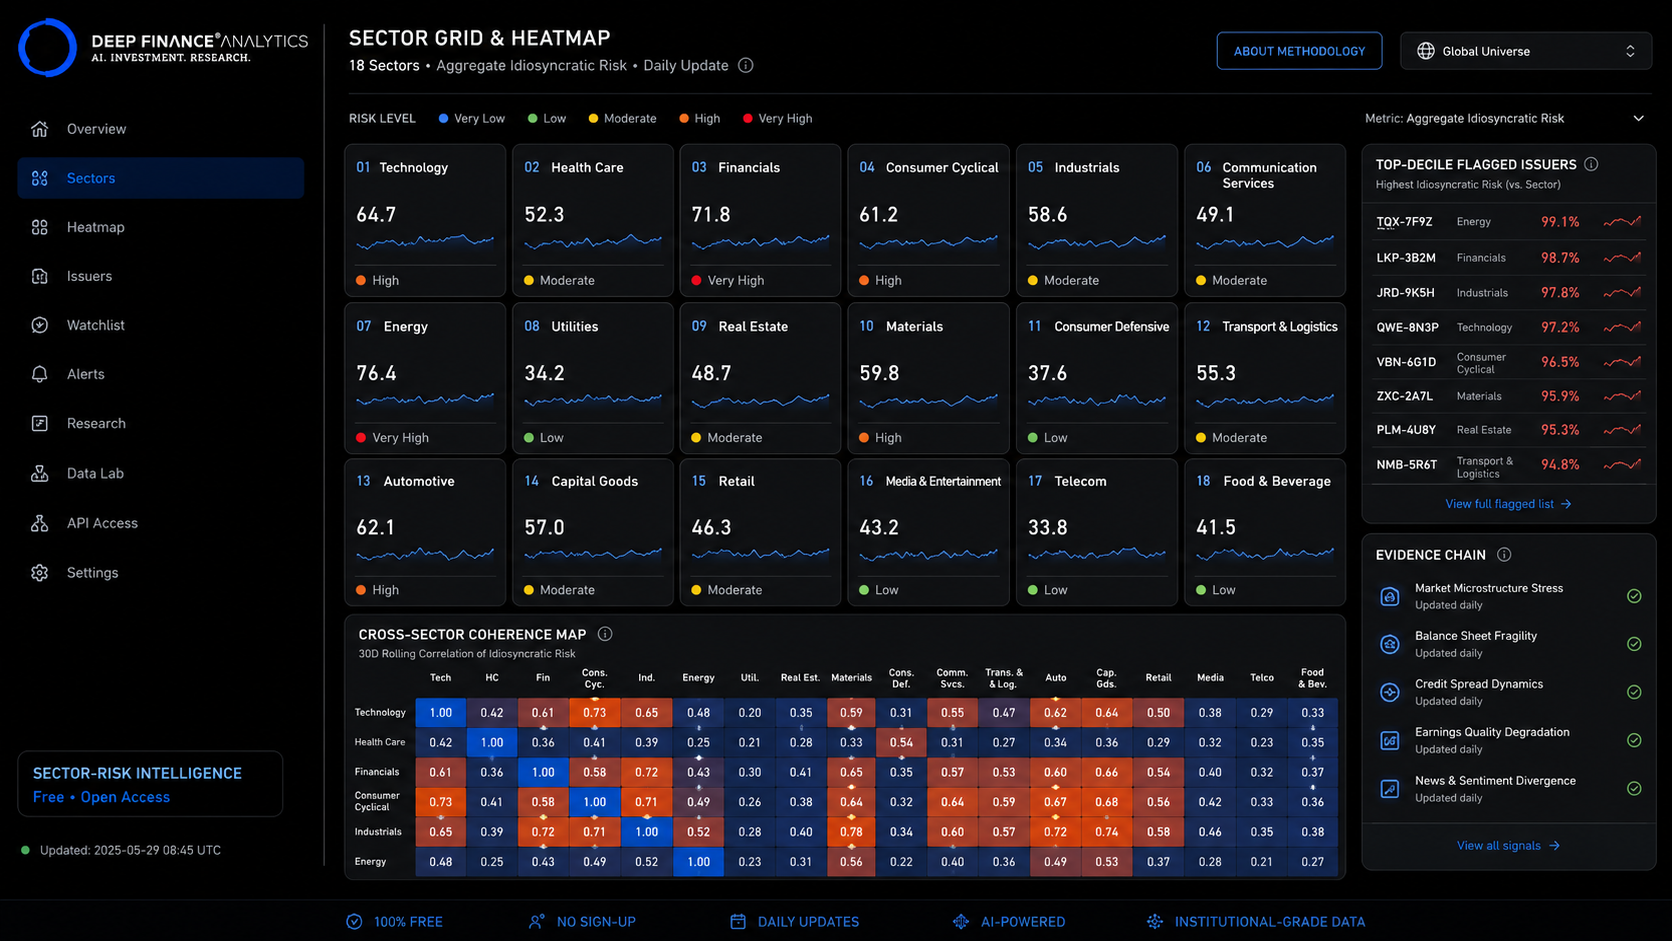
For each sector we cover (currently 18 GICS-aligned sectors and sub-sectors, with custom cuts available in paid tiers), the screen shows:
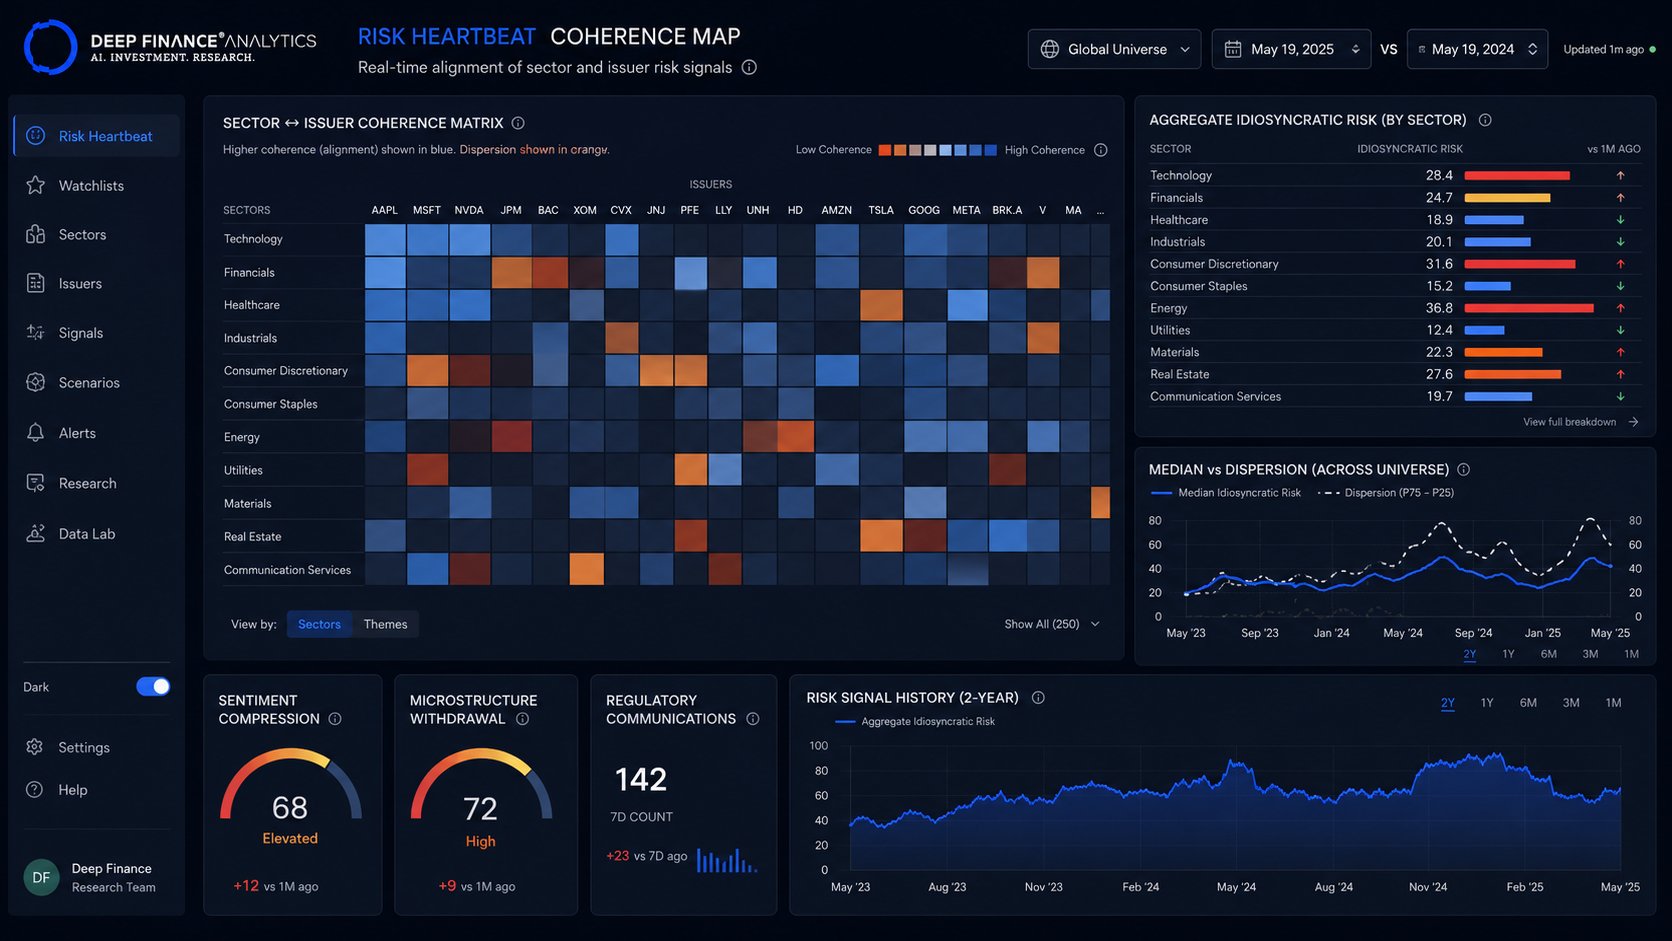
- The aggregate idiosyncratic-risk score for the sector — the median and the dispersion across constituent issuers.
- The Risk Heartbeat coherence map — for which issuers in the sector are multiple agents flagging signals simultaneously?
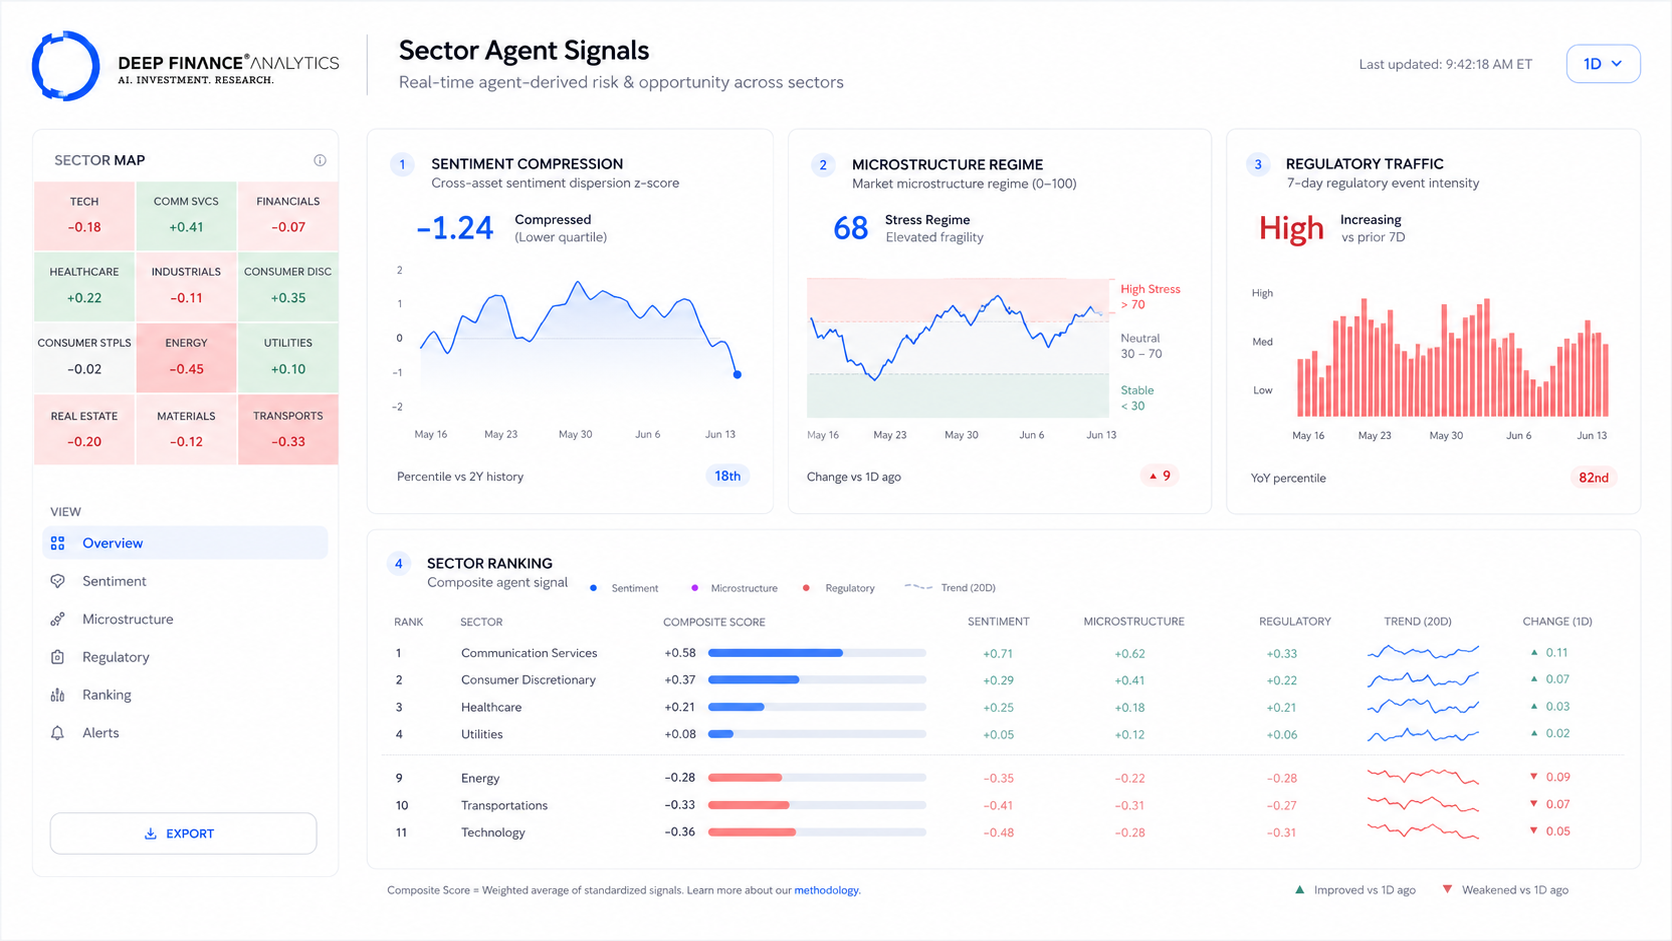
- Sentiment compression indicator — how alike is management commentary across the sector this quarter?
- Microstructure regime indicator — bid-ask, depth, and trade-frequency anomalies aggregated by sector.
- Regulatory traffic — count and severity of supervisory communications affecting the sector.
- Top-decile flagged issuers — anonymised in the free tier, named in paid tiers.
You can compare any sector to any other sector. You can compare current state to any prior date over the trailing two years. You can export the underlying time series.
How to use it
Three patterns we see most often from free-tier users.
Pattern 1 — Weekly sector pulse
A portfolio manager opens the platform once a week and scrolls through the sectors most relevant to their mandate. The view is fast — under a minute per sector — and gives a structured read of where the sector's idiosyncratic risk is trending relative to last week and last quarter. Anything materially elevated triggers a closer look.
Pattern 2 — Hypothesis testing
An analyst has a thesis — for example, "AI-infrastructure mid-caps are starting to roll over." They open the platform, navigate to the relevant sub-sector, and check whether the agent-derived signals support the thesis. If the answer is yes, they have a data-grounded starting point for a deeper memo. If no, they have a useful disconfirmation.
Pattern 3 — Reading our Insights with context
Several readers of this blog use the platform alongside the monthly Risk Heartbeat issues. When we write about the Financials liquidity signature or the commodity-financing dispersion, readers go to the platform to see the sector view themselves. The result, in our experience, is a much more useful read of the post — and frequently the start of a substantive conversation with our team.
What is in the free tier
The free tier is genuinely useful:
- All 18 sector views, refreshed daily.
- Two-year history on all aggregate metrics.
- Top-decile issuer flags (anonymised).
- Trailing 90-day evidence chain (summary form).
- Export of aggregate time series.
The free tier covers the full investable universe of publicly listed names in developed and large emerging markets. It does not cover private credit, private equity, or proprietary universes.
Where the paid tiers add value
Three directions of paid extension, each driven by client demand:
- Issuer-level naming. Paid tiers name the flagged issuers, with the full Epsilon score and evidence chain for each.
- Custom universe. Add private credit, fund holdings, or proprietary issuer lists to the platform. The same agent stack and scoring apply.
- Integration with PortIQ / CyronOS. The platform becomes a sector lens inside your portfolio view, with positions overlaid on the sector risk map.
The credit-based pricing means the natural path is to start free, identify the specific extension that would unblock a workflow, and add only that capability. Most paid users started in the free tier.
What the platform is not
A few clarifications that prevent over-expectation:
- It is not a prediction system. The aggregate scores are observations of current state, not forecasts. We use the platform for situational awareness, not for trading signals on its own.
- It is not a replacement for fundamental analysis. It is a complement. A sector with elevated agent signals warrants a closer look; what the closer look reveals is fundamental work that has not been outsourced.
- It is not a screen for new ideas. The platform tells you which sectors are stressed, not which sectors are attractive. The two are sometimes related and sometimes not.
Why we ship this free
Three reasons, plainly:
- The cost story makes it possible. The two-tier agent design (last week's post) brings the per-sector inference cost to a level where we can offer the sector view without unit economics that punish us.
- It is the best demonstration of the platform. The free tier shows in five minutes what a deck cannot show in an hour: the agent stack, the coherence rules, the Risk Heartbeat output, the evidence chain. A platform that is good earns trust by being used.
- It serves the editorial mission. We publish Risk Heartbeat publicly because we believe sector and regime context is a public good worth contributing to. The free-tier platform is the natural companion.
How to activate
The free tier is available immediately at analytics.deep-finance.com/products under the Standalone Products category. There is no waiting list, no sales call required, and no obligation. Account creation takes under two minutes; the sector views are populated for the trailing two years from day one.
If you want to go deeper — issuer-level naming, custom universe, or full integration with PortIQ / CyronOS — the discovery call is the right next step.
Coming next
28 April — Risk Heartbeat #04, plus the mid-cycle Aspects note on commodity-financing dispersion. In May we shift to back-to-back ML & Quant Methods posts: a VaR vs. CVaR benchmark on 2008 and 2020, then a deep dive on time-series forecasting at the engine level.
Frequently asked questions
What is the Industry Risk Intelligence Platform?
A free-tier sector risk lens covering 18 GICS-aligned sectors and sub-sectors. Aggregate idiosyncratic-risk scores, Risk Heartbeat coherence maps, sentiment compression, microstructure and regulatory signal — refreshed daily, with two years of history.
Is the Industry Risk Intelligence Platform actually free?
Yes. The free tier covers all 18 sector views, daily refresh, top-decile anonymised flags, and basic evidence chain. Account creation takes under two minutes.
How is the platform different from a typical sector dashboard?
Most sector dashboards aggregate price and earnings data. This platform also surfaces narrative coherence, microstructure withdrawal, and regulatory traffic — the agent-derived layers that often move before price.
Can I see issuer-level data on the free tier?
Top-decile flagged issuers are anonymised in the free tier. Paid tiers name the issuers and provide full Epsilon scores and evidence chains.
Does the platform make predictions?
No. Aggregate scores are observations of current state, not forecasts. The platform supports situational awareness, hypothesis testing, and contextual reading of our published research.
Related reading
- Epsilon: scoring idiosyncratic risk for IC review
- Two-tier agents: the cost and quality argument
- Aspects Q1 — Financials: liquidity-stress signatures
External references
- Industry Risk Intelligence Platform product page
- Deep Finance Analytics — products overview
- GICS sector classification
About the author — Product Marketing — Deep Finance Analytics. Product Marketing translates engineering and quant work into the narratives, factsheets, and walkthroughs used by clients. See the Insights hub for the full archive, or book a discovery call to discuss this post with the team.